You can download our Indicators of Digital Inclusion and Analytical Framework resources.
Introduction and background
A group of organisations with experience in Digital inclusion (DI) from various private, public and academic organisations were brought together by Good Things Foundation. The aim of the group was to look at how we estimate the extent of Digital inclusion (DI) in the UK.
It was recognised that while large public and private datasets on elements of digital inclusion do exist, these tend to focus on one barrier of DI. Therefore no one dataset exists that shows the depth and breadth of digital inclusion in relation to multiple barriers that may impact DI. Example of factors:
- Access a device that connects to the internet
- Access to an internet connection
- Having the skills and knowledge to complete tasks online.
The development process
The aim was to decide on a small number of questions that would be ”good enough” ,that can be recommended to others, to best measure Digital exclusion/inclusion.
We knew that the style and number of questions needed to be kept short and simple, for multiple reasons. Firstly we were aware that space for surveys, to add questions, is limited so we wanted to limit the number of questions to allow for more surveys to be able to utilise them. In addition to this the group also recognised the need to consider language and literacy levels of the survey's recipients by ensuring that the wording of the questions was simple and easy to understand. As the number of questions needed to be kept small there was a view that realistically the questions may not be able to cover all aspects of DI in depth but would be “good enough” to evaluate DI.
Questions were compiled from previous surveys including Ofcom and Minimum Digital Living Standard (MDLS) and reviewed for key themes. A key conclusion from this exercise was that the existing surveys tended to focus on one element of digital exclusion. For example Ofcom’s Adult Media Literacy Tracker and Lloyd’s Consumer Digital Index (CDI) focused on the skills elements of digital inclusion and exclusion, without a lens to also look at how access to the internet (through connection or device) may be impacting individuals.
As a result of this we knew we wanted to be able to look at an individual’s experience of digital inclusion as a whole. Workshops were held to discuss the key components we wanted to be included in the question designs. Within these workshops we discuss the barriers to digital inclusion and how these would need to be addressed in the questions
All these elements were brought together to create the core digital inclusion questions.

Show image description Hide image description
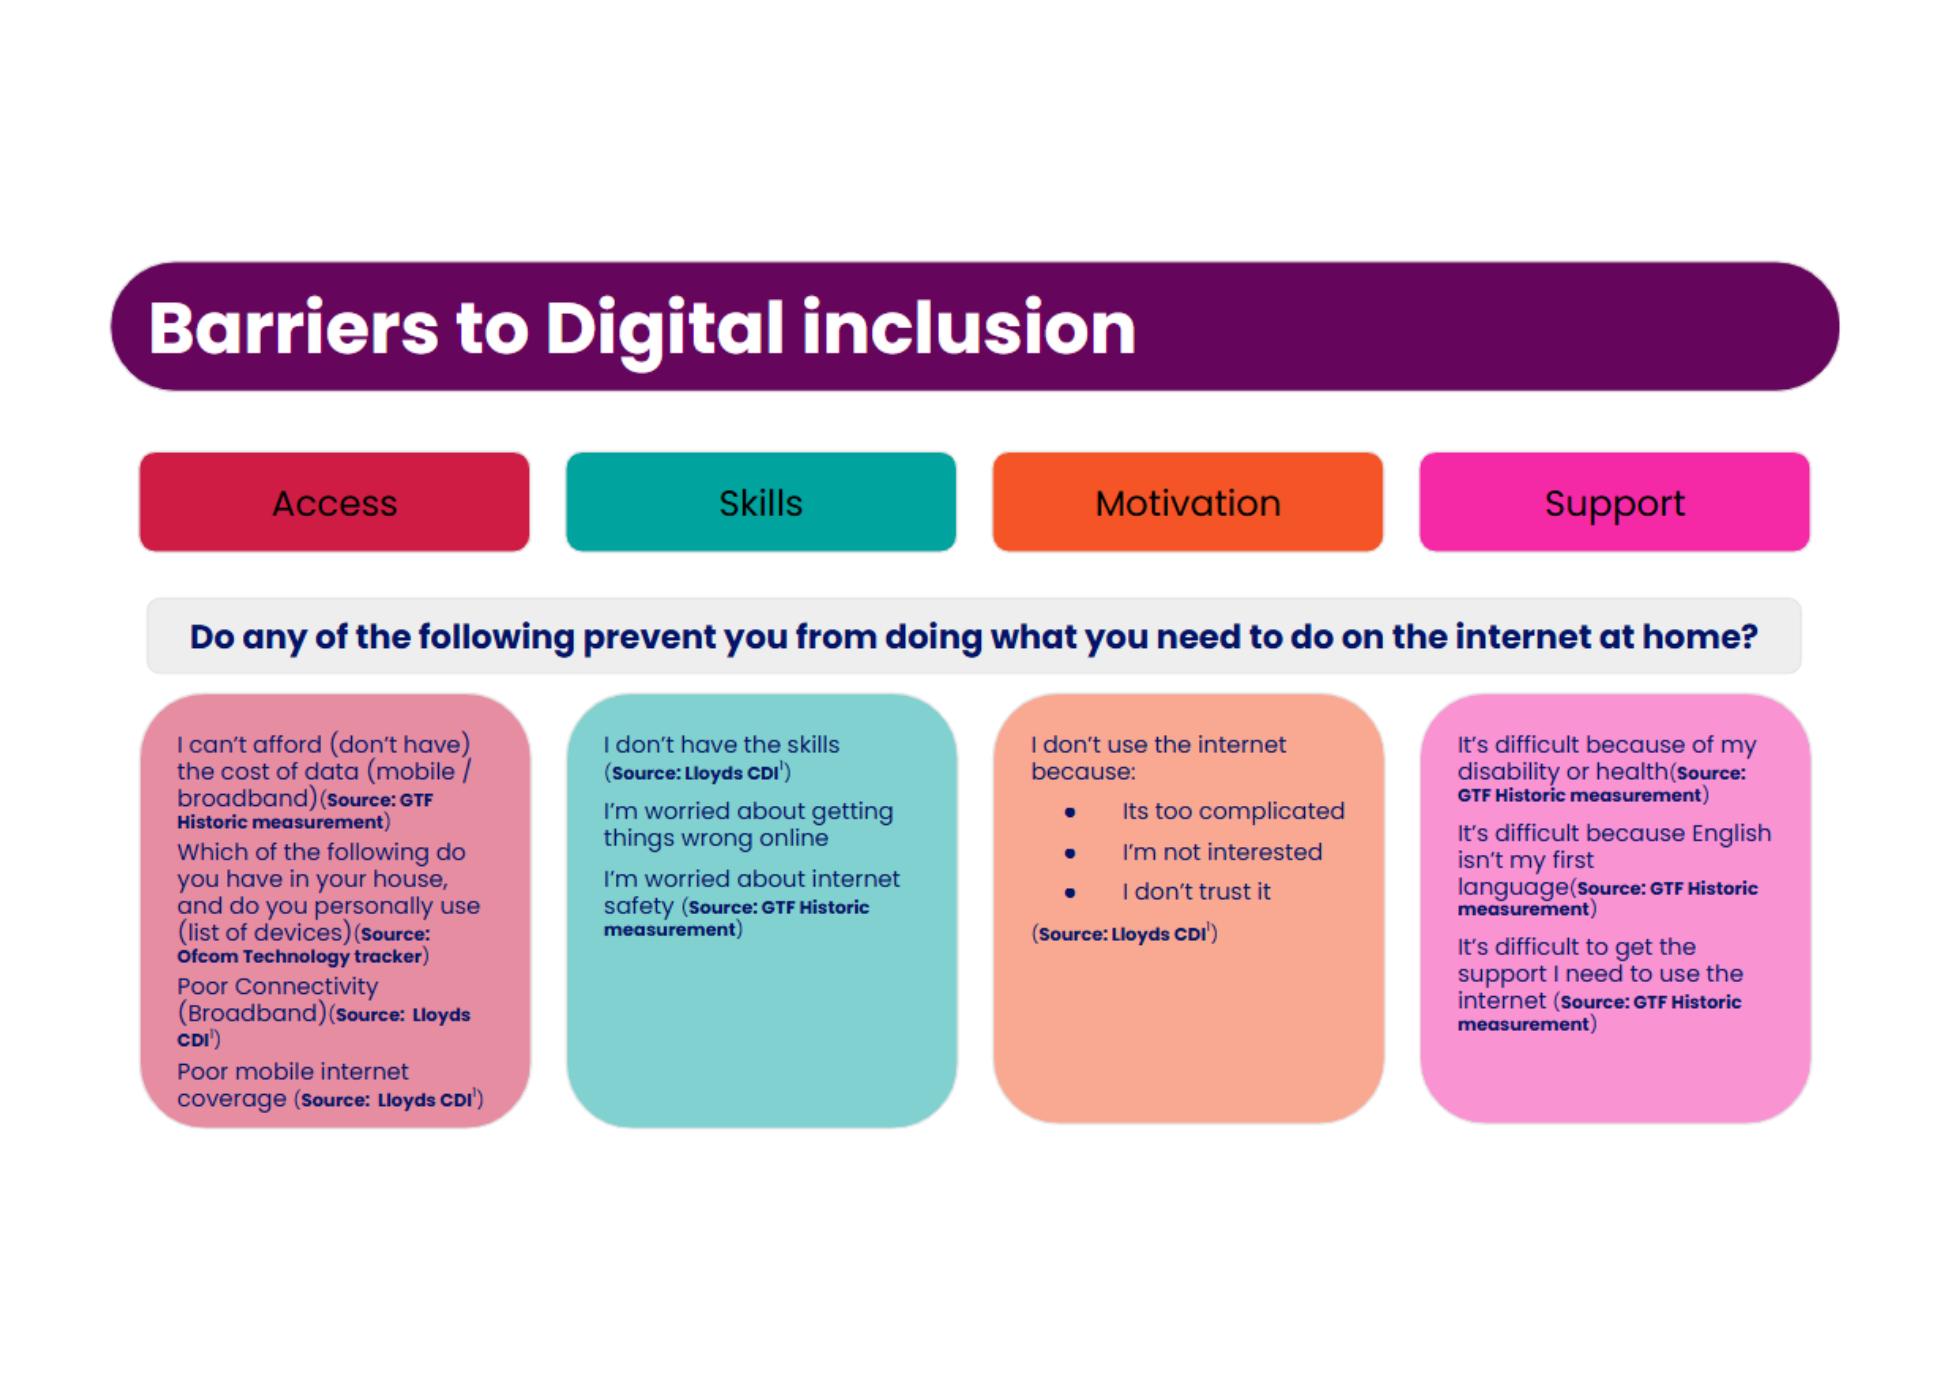
This image shows eleven statements about barriers to digital inclusion, taken from previous survey questions, and groups them into four key themes.
At the top is the question: “Do any of the following prevent you from doing what you need to do on the internet at home?”
There are four columns, each labelled with a different theme: Access, Skills, Motivation, Support. Each column contains a statement taken from a past survey question, and its source:
Access:
- "I can't afford (don't have) the cost of data (mobile/broadband)" - Source: GTF Historic Measurement)
- "Which of the following do you have in your house, and do you personally use (list of devices)" - Source: Ofcom Technology Tracker
- "Poor Connectivity (broadband)" - Source: Lloyds CDI
- "Poor mobile internet coverage" - Source: Lloyds CDI
Skills
- "I don't have the skills" - Source: Lloyds CDI
- "I'm worried about getting things wrong online"
- "I'm worried about internet safety" - Source: GTF Historic Measurement
Motivation
- "I don't use the internet because: It's too complicated / I'm not interested / I don't trust it" - Source: Lloyds CDI
Support
- "It's difficult because of my disability or health" - Source: GTF Historic Measurement
- "It's difficult because English isn't my first language" - Source: GTF Historic Measurement
- "It's difficult to get the support I need to use the internet" - Source: GTF Historic Measurement
The Indicators of Digital Inclusion (IDI)
The indicators are designed to act as layers. Each question builds greater understanding.
The aim is to use them all together. If space is short, just 1 can be asked, or just 1 and 2 can be asked.
1. Which of the following apply to you? (tick one)
1.1 I go online as much as I want
1.2 I go online but want to go online more
1.3 I do not go online and don't want to go online
1.4 I do not go online but want to go online
2. Which of the following apply to you? (tick all that apply)
2.1 I own or have regular access to a device (i.e. laptop, tablet, mobile phone) that meets/could meet my online needs
2.2 I own or have regular access to a mobile internet connection that meets my online needs
2.3 I own or have regular access to a broadband internet connection that meets my online needs
2.4 I have the knowledge and skills to do most things I need to online
2.5 I am confident to do most things l need to online
2.6 I depend on others to do things for me online
2.7 None of these apply to me
3. Which of the following apply to you? (tick all that apply)
3.1 If I needed help to do things online I would know how to get support
3.2 I am worried about being safe online
3.3 I couldn’t afford to repair/replace a device (i.e. laptop, tablet, mobile phone) if it broke
3.4 I am struggling to afford a mobile internet connection
3.5 I am struggling to afford a broadband internet connection
3.6 I solely depend on public computers to do things online
3.7 I solely depend on Wifi outside of home to do things online
3.8 None of these apply to me
IDI use cases
The indicators can be used in a few different ways, below are use cases of how the indicators could be used. This list should not be seen as exhaustive.
Use Case 1 - Embed in existing surveys
The indicators can be incorporated into an existing survey to evaluate DI within the remit of an existing survey.
This can provide an additional lens for the existing data to be interpreted. For example if the indicators are incorporated into a residents survey run by a local authority, the indicators can give a lens through which to interpret the other indicators. If the survey is to look at how people contact the local authority, these indicators can give insight into why some residents won't contact the council online and shed light on the interventions that may be required to support these individuals to access online services.
To give a further example, this information gathered can also be used by Local authorities to analyse other areas of interest. For example, taking up for a programme to deliver grants for school uniforms may receive a lower than expected response in part due to the fact that the grant must be applied for online.
Use Case 2 - Triaging service users
The indicators can also be used as a tool to triage individuals, to assess their Digital needs.
This could be done in a few ways, the first being when an individual presents at a location looking for support to access or engage with a service, the individual's needs can be assessed using these indicators to show the depth and breadth of the digital inclusion need. This can then help individuals receive the targeted help they may need to remove barriers and to identify vulnerabilities they may face to accessing the services digitally in the future.
Use case 3 - Recording accessibility requirements
Building indicators into call centre or registration processes the indicators could be used to identify access needs and contact preferences for future service use. The indicators can be grouped to flag how online, offline or how vulnerable an individual's access to the online world may be. In this case the GP could make a decision on how best to contact the individual.
Analytical Framework
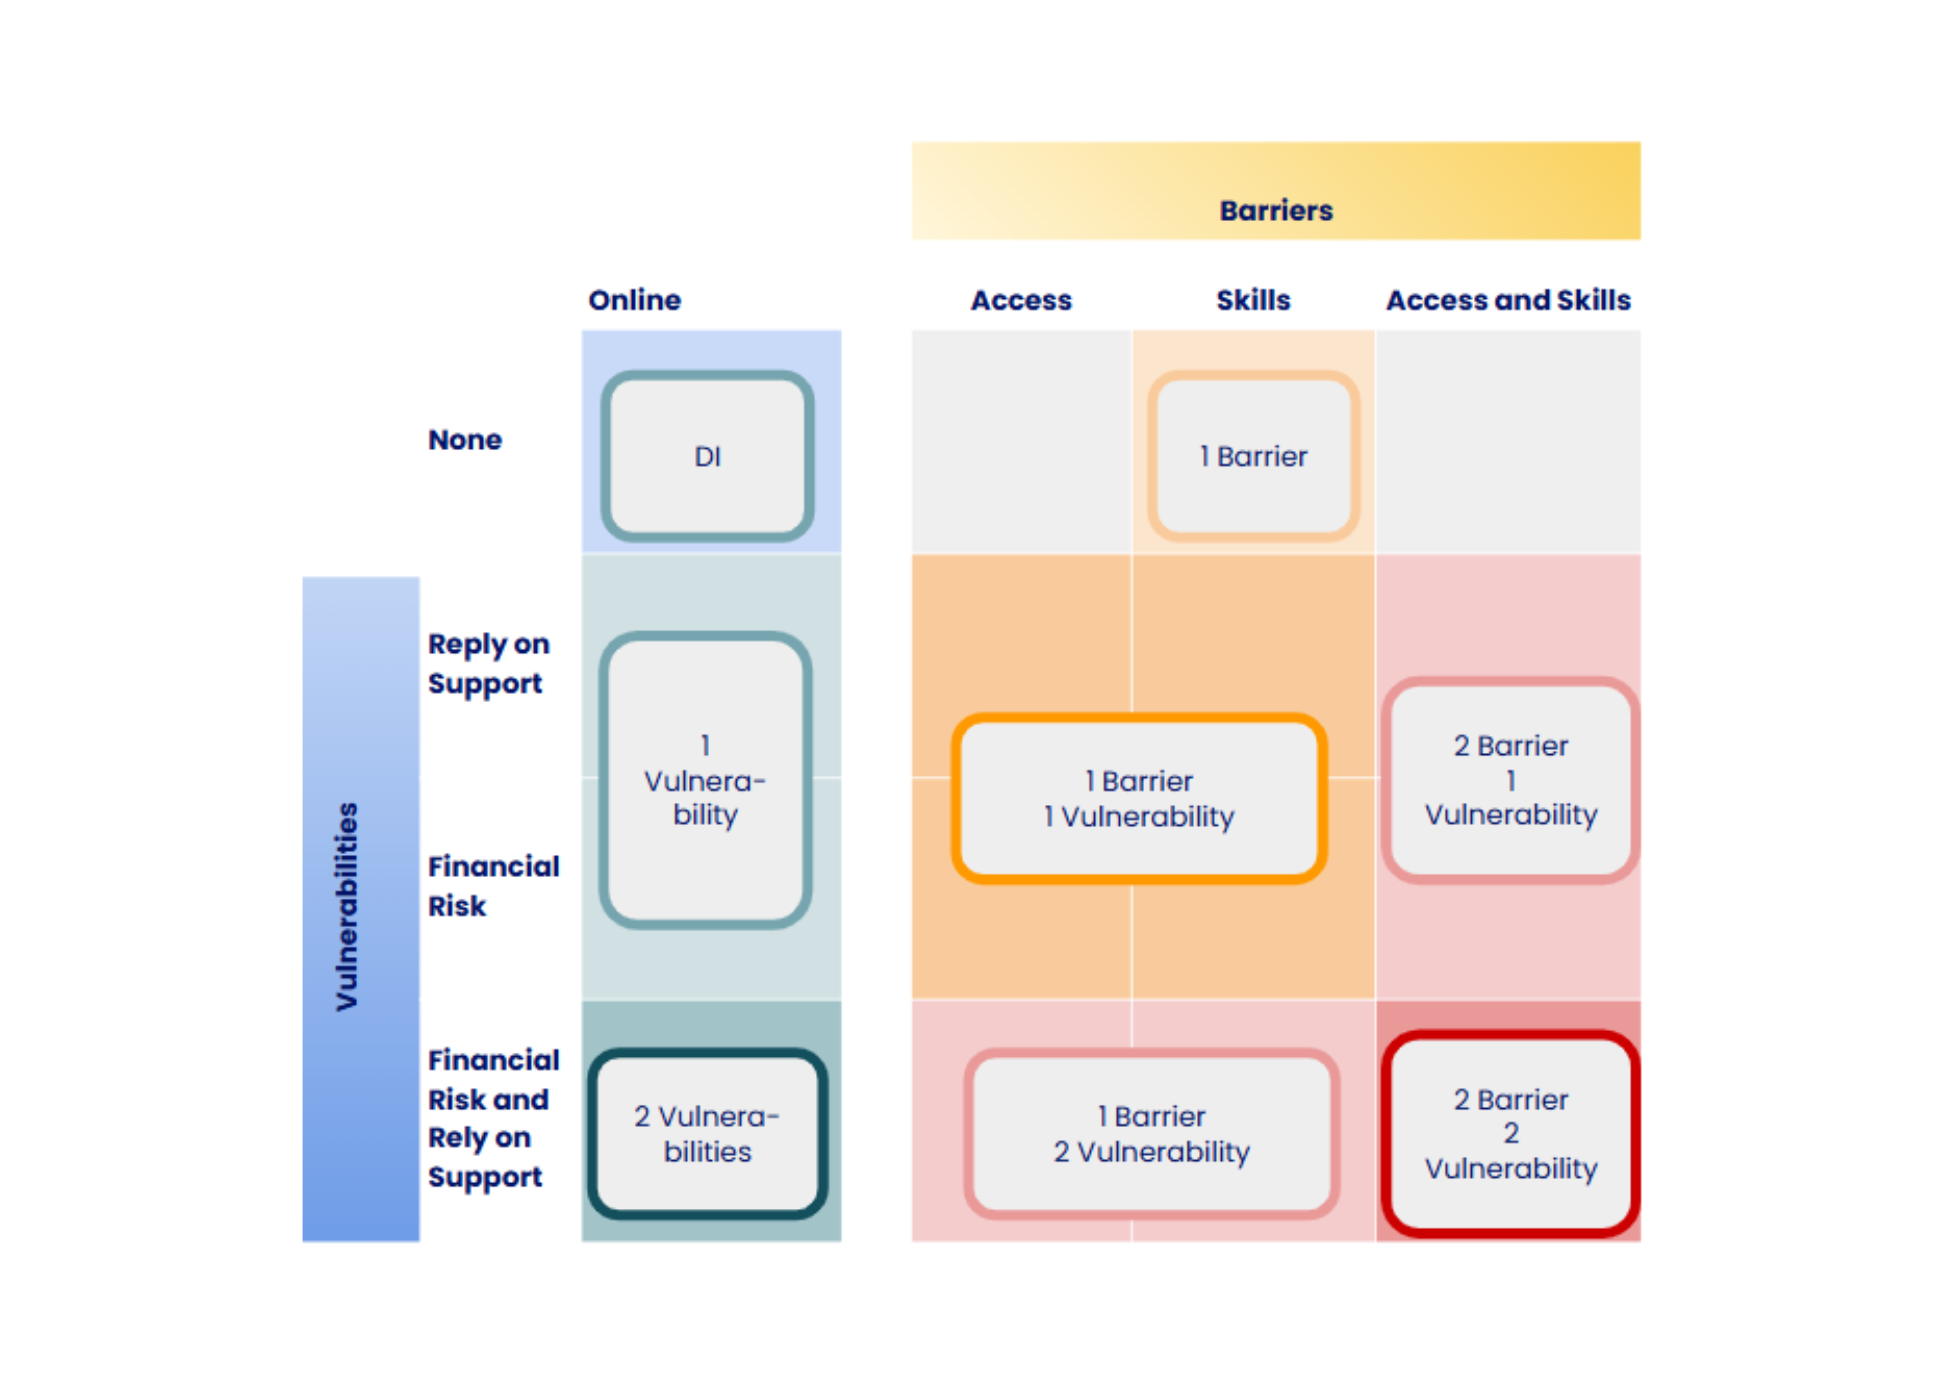
In order to evaluate Digital exclusion and the extent to which someone is digitally excluded, we have developed a matrix which evaluates the population , or individual, by the barriers and vulnerabilities they may have. This creates 8 different spaces an individual can fall. The grid helps to show how barriers and vulnerabilities can be layered up to show depth of Digital exclusion.

Show image description Hide image description
This image is a matrix-style diagram explaining different levels of digital exclusion based on vulnerabilities and barriers.
The matrix is divided into four rows and four columns. The y-axis, labelled "Vulnerabilities," has four categories, each corresponding to a row. From top to bottom:
- None
- Rely on Support
- Financial Risk
- Financial Risk and Rely on Support
The x-axis, labelled “Barriers”, has 4 categories, each corresponding to a column. From left to right:
- Online [i.e. no barriers]
- Access
- Skills
- Access and Skills
Matrix Cells and Categories
Each cell within the grid represents a different level of digital exclusion, combining a specific vulnerability with a specific barrier. The cells are coloured and grouped to highlight eight categories of exclusion into which an individual can fall:
- DI [Digital Inclusion]: the cell in the top left corner corresponds to Vulnerabilities: None; Barriers: Online. This is the lowest level of digital exclusion on the matrix.
- 1 Barrier
- 1 Vulnerability
- 1 Barrier, 1 Vulnerability
- 2 Barriers, 1 Vulnerability
- 2 Vulnerabilities
- 1 Barrier, 2 Vulnerabilities
- 2 Barriers, 2 Vulnerabilities: the cell in the bottom right corner corresponds to Vulnerabilities: Financial Risk and Rely on Support; Barriers: Access and Skills. This is the highest level of digital exclusion on the matrix.
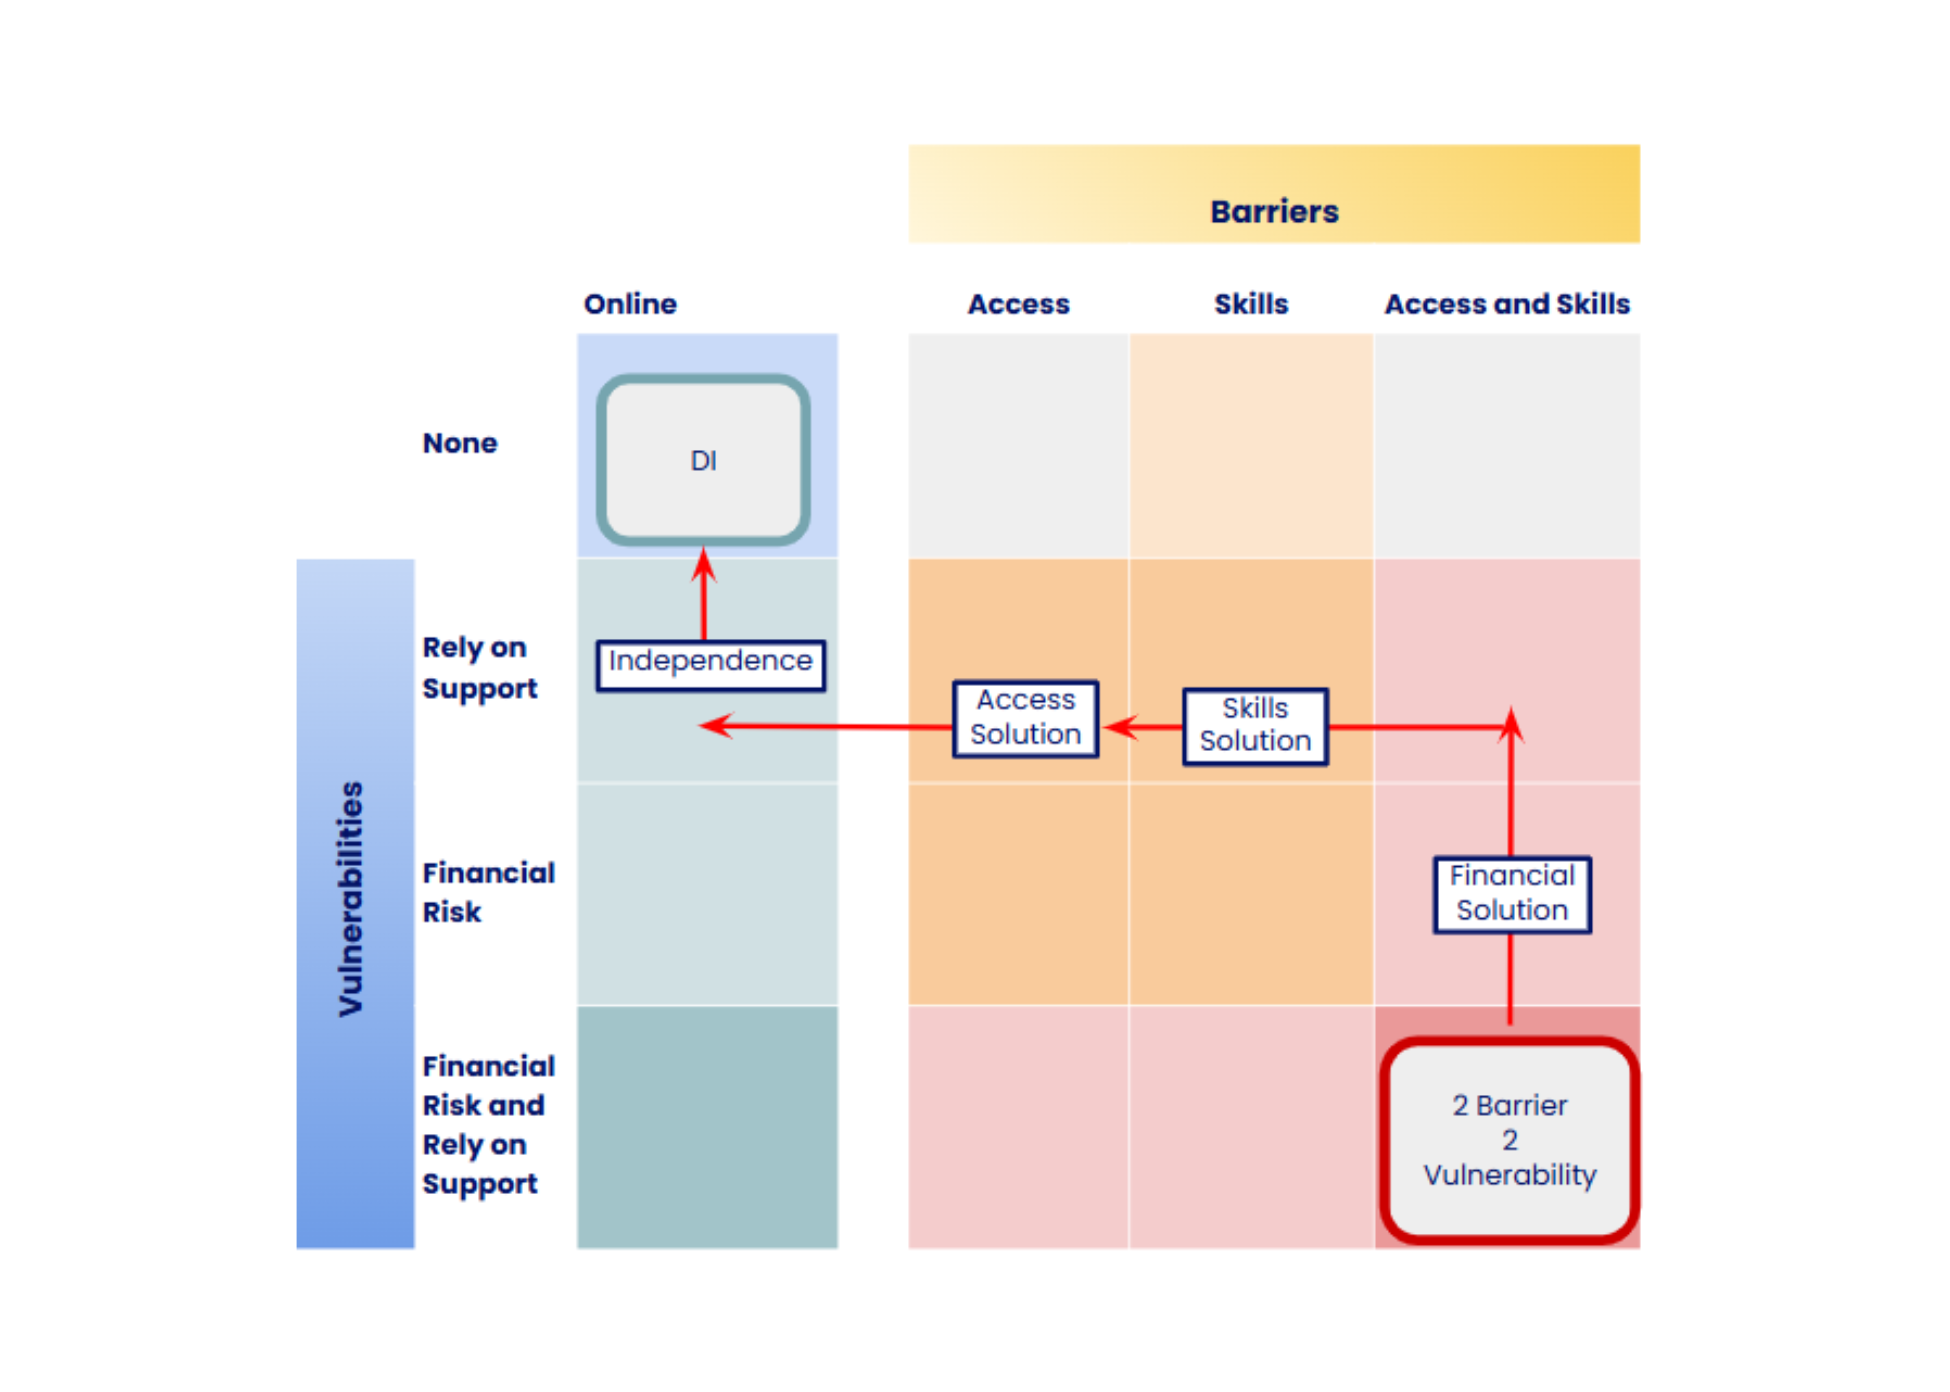
While showing the position someone may fit in the matrix, this grid also helps to highlight what steps an individual may need to take to achieve digital inclusion.

Show image description Hide image description
The image is a second version of the matrix diagram on digital exclusion, showing an example pathway to inclusion through solutions.
The overall structure of the matrix remains the same as the previous version, with the same categories along the X and Y axes.
The pathway begins in the bottom right cell: 2 Barriers, 2 Vulnerabilities. As in the previous matrix, this category represents the highest level of digital exclusion.
Labelled arrows show the step-by-step solutions along a linear pathway, taking an individual from this bottom right cell to the top left cell (DI - representing digital inclusion):
- Financial solution - moves you two cells up, to the Barriers: Access and skills; Vulnerabilities: Rely on Support cell
- Skills solution - moves you two cells left, to the Barriers: Access; Vulnerabilities: Rely on Support cell
- Access solution - moves you one cell left, to the Barriers: Online; Vulnerabilities: Rely on Support cell
Independence - moves you one cell up, to the top left cell (DI): Barriers: Online; Vulnerabilities: None
Building collective knowledge
The true value of consistently using these questions in multiple settings is the collective understanding that this builds. To help us better understand how Digital Exclusion impacts on your audiences and the population as a whole we would love to discuss with you how your data can contribute to the collective knowledge and understanding.
We ask of you:
We ask that you share data and findings with us, to help us build a bigger picture of Digital inclusion. This doesn’t need to be all your data, it could be just a few demographics and the IDI questions and we would never ask that you share anything that is business sensitive, commercial in confidence or contains personal data. Data sharing or confidentiality agreements can be put in place to assist this.
Our Commitment to you:
We will refresh and update analysis of the combined data, making it available to use by all. Where required we may also be able to help you understand how your population differs from the general population and work with you to tell this story to others.
Want to find out more?
For more information on the Indicators of Digital Inclusion, please email us at research@goodthingsfoundation.org
In collaboration with


